


- 2017-2021 No. of Publications
- 2017-2021 Research Areas
- 2017-2021 Categories
- 2017-2021 Top Topics
- 2017-2020 No. of Citation
in High Impact Journals - 2017-2021 Distribution of
Categories in High Impact Journals - 2017-2021 Distribution of
High Impact Journals - 2017-2021 Top Ten Highest
Impact Journals
INNOVATIONS
Always on the lookout for
NEW INNOVATIONS
The number of published documents increased by 30% during the past five years
No. of Publications
- 2017 5,383
- 2018 5,927
- 2019 6,367
- 2020 6,934
- 2021 7,731
INNOVATIONS
2017-2021 Research Areas
Publications by GIPP* Research Areas
In which research area are authors publishing most?
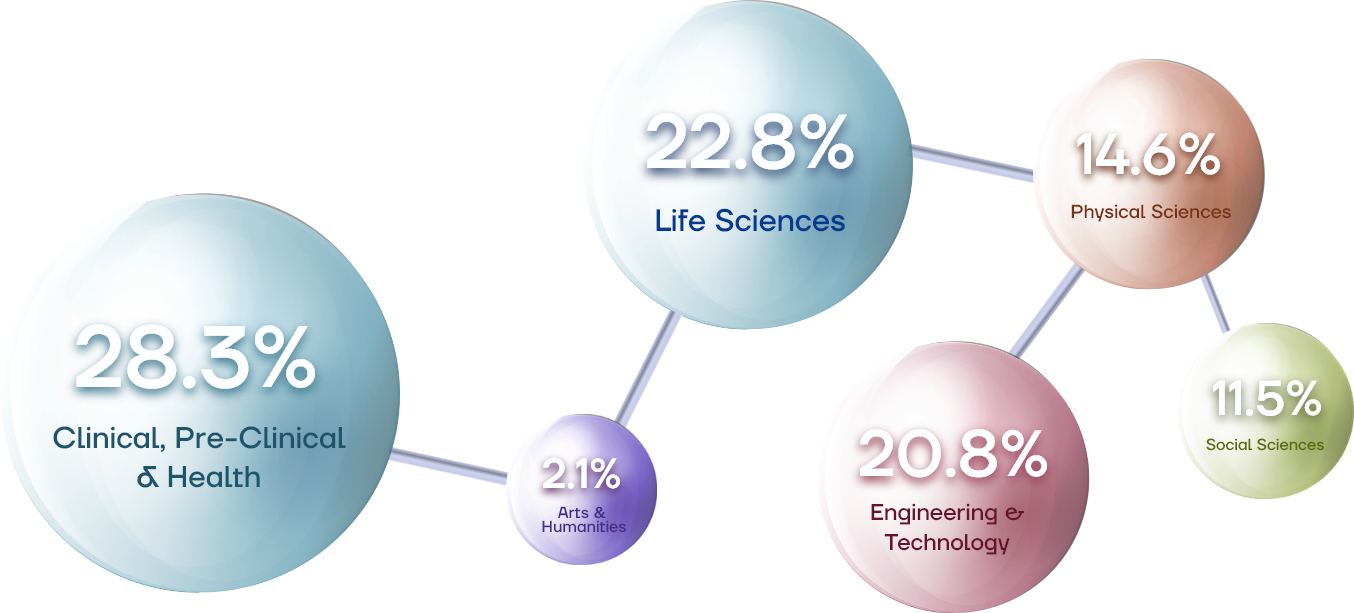
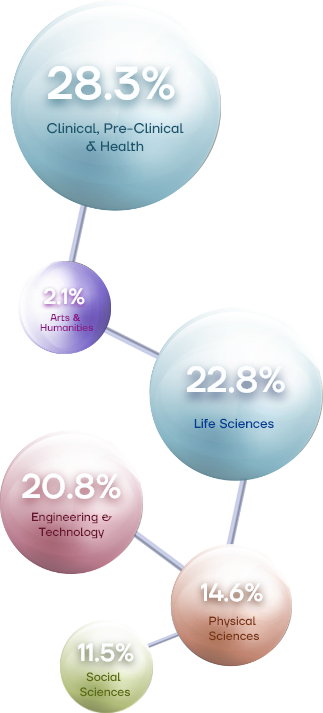
Remark: *The GIPP scheme comprises six broad disciplines but covers all fields of scholarly research. For more information, please refer to here.
Indicators: Web of Science Publications. Time Period: 2017 2021. Schema: GIPP. Organization Name: Chinese University of Hong Kong. Research Area: NOT OVERALL. Dataset: InCites Dataset InCites dataset updated Jun 28, 2022. Includes Web of Science content indexed through May 31, 2020.Export Date: Jul 4, 2022.
INNOVATIONS
2017-2021 Categories
No. of Publications by Categories*
In which categories are authors publishing most?
-

Engineering, Electrical & Electronic 3,300
-

Oncology 1,645
-

Computer Science, Artificial Intelligence 1,533
-
Materials Science, Multidisciplinary 1,427

-
Gastroenterology & Hepatology 1,366

Remark: *Web of Science Categories are assigned at the journal level. All items in a journal will be assigned the Web of Science Categories of the journal it is published in. For more information, please refer here.
Indicators: Web of Science Publications. Time Period: 2017 2021. Schema: GIPP. Organization Name: Chinese University of Hong Kong. Research Area: NOT OVERALL. Dataset: InCites Dataset InCites dataset updated Jun 28, 2022. Includes Web of Science content indexed through May 31, 2020.Export Date: Jul 4, 2022.
INNOVATIONS
2017-2021 Top Topics
Most Researched Topics
What are the hottest topics that CUHK researchers have been working on?
JOURNALISM
PHYSICAL ACTIVITY
LANGUAGE POLICY
MULTI AGENT SYSTEMS
COMPLEX NETWORKS
HEPATOCELLULAR CARCINOMA
ORGANIC SOLAR CELLS
STANDARD MODEL
CORONAVIRUS
JOURNALISM
PHOTOCATALYSIS
DIABETIC RETINOPATHY
SELF-REGULATED LEARNING
DISTRIBUTED STORAGE SYSTEMS
DEEP LEARNING
HBV
NSCLC
NAFLD
SUPERCAPACITOR
AEROSOLS
AIR POLLUTION
NETWORK CODING
PD-1
ENERGY HARVESTING
CHINA
AEROSOLS
DEMENTIA
CORPORATE GOVERNANCE
GRAVITATIONAL WAVES
OPTION PRICING
Indicators: Web of Science Publications. Time Period: 2017 2021. Schema: GIPP. Organization Name: Chinese University of Hong Kong. Research Area: NOT OVERALL. Dataset: InCites Dataset InCites dataset updated Jun 28, 2022. Includes Web of Science content indexed through May 31, 2020. Export Date: Jul 4, 2022.
INNOVATIONS
2017-2020 No. of Citation in High Impact Journals
By Journal Quartile*
| Q1 | Q2 | Q3 | Q4 | |
|---|---|---|---|---|
| 2020 | 3,598 | 1,406 | 658 | 261 |
| 2019 | 3,073 | 1,254 | 593 | 222 |
| 2018 | 2,780 | 1,151 | 440 | 197 |
| 2017 | 2,504 | 1,015 | 439 | 196 |
- Documents in Q1 Jounrnals
- Documents in Q2 Jounrnals
- Documents in Q3 Jounrnals
- Documents in Q4 Jounrnals
The Quartile in Category shows the relative location of a journal along the range of an Impact Factor distribution.
- Each subject category of journals is divided into four quartiles: Q1, Q2, Q3, Q4.
- Q1 is occupied by the top 25% of journals of a subject category;
- Q2 is occupied by journals in the 25 to 50% of the subject category;
- Q3 is occupied by journals in the 50 to 75% of the subject category;
- Q4 is occupied by journals in the remaining 75 to 100% of the subject category
Quartile rankings are therefore derived for each journal in each of its subject categories according to which quartile of the IF distribution the journal occupies for that subject category. For more information, please refer to here.
Indicators: Web of Science Publications. Time Period: 2017 2021. Schema: GIPP. Organization Name: Chinese University of Hong Kong. Research Area: NOT OVERALL. Dataset: InCites Dataset InCites dataset updated Jun 28, 2022. Includes Web of Science content indexed through May 31, 2020.Export Date: Jul 4, 2022.
INNOVATIONS
2017-2021 Distribution of Categories in
High Impact Journals (CUHK-led)*
*High impact journals refer to impact factor ≥ 20.
**affiliated at CUHK and in the capacity as first or corresponding author